Re-evaluating the Gauquelin Data
PAGES
- Introduction
- Expected and Observed planetary frequencies in the Gauquelin professional groups
- The Ertel Enigma
- Report by the French Skeptics, 1982-96
- The Work of Arno Müller
- From the Archives
- Synastry Effects in the Gauquelin 'Heredity' Data
- Poets and the Moon
- Character traits
- Venus
- Database of Character-Traits
- Introvert-Extravert
- Physicians and Sports Champion Data
- Where's the Data?
- Was It Significant?
- A Fourfold Effect
- The Shape of the Gauquelin Professional-Data Effect
- Astro-Psychological Problems
- Françoise and Michel, a Productive Partnership
2. Expected and Observed planetary frequencies in the Gauquelin professional groups
2a Download data-set .zip file here
This data-set was kindly sent by Mark Pottenger, as used in his CCRS computer program around 1990. (He prepared this, after the Gauquelin data had all been re-checked using the ACS (Astro-computing Services) computer and converted into digital form, in the 1980s by Neil Michelson and Tom Shanks in California).
The data here gives the main professional groups, as the Gauquelins published them, with frequencies for all planets both observed and expected (i.e. 'control' values) for all of the 12, 18 and 36-fold divisions of the diurnal circle, i.e 'Gauquelin sectors'.
This data is probably the best possible source for the expected planetary scores in Key Sectors, and used what Mark Pottenger called his 'Astro-demographic' frequency method. It covers the nine different Gauquelin professional groups, with two text files for each of these. These give the expected (e) and observed (s) values for the eminent actors (1409), sports champions (2088), journalists (675), military (3046), musicians (1248), painters (1472), politicians (1002), scientists (3643) and writers (1352).
2b Graph of expected frequencies for the twelve G-sectors for four planets 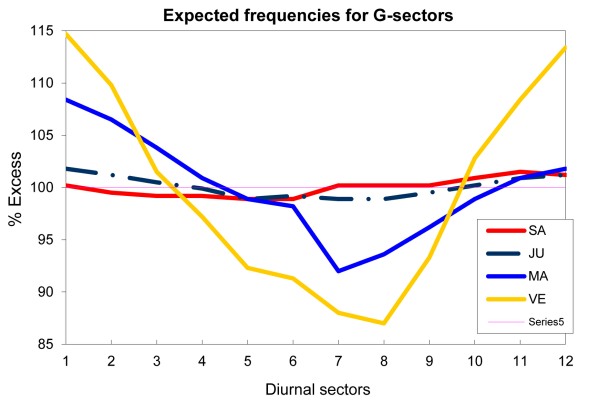
2c Expected frequencies for five planets, summing the two Key Sectors 1+4, as a percentage of the total groups: for six professional groups: Actors, sports champions, military, painters, scientists and writers. These are the chance-expected levels using M.P.'s 'astro-demographic' method. 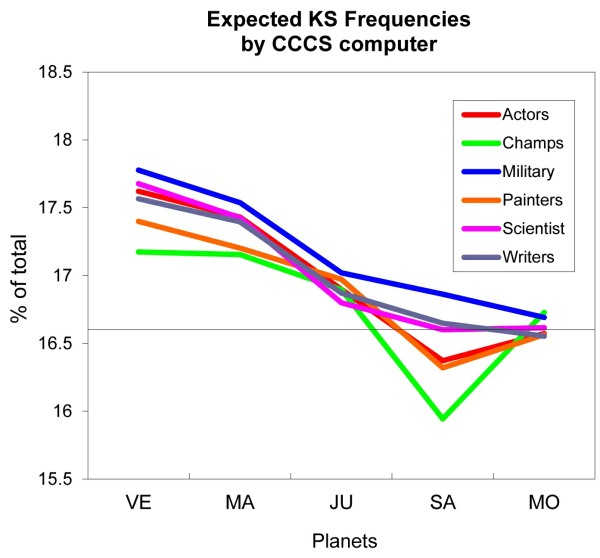
Eight professional groups
Here are the main professional groups for which the Gauquelins collected data. The table shows first the total number in each group, then how many times a planet scored in one of the Key Sectors, and then the chance-expected frequency of that score. The percentage excess in the last column comes from these last two figures. Their biggest effect came from 1352 writers, with the Moon showing a 29% excess in the Key Sectors; while the strongest negative effect came from Mars and Saturn with painters, both showing -18%.
| Profession | Totals | Planet | Key Sectors | Expect. | %X |
|---|---|---|---|---|---|
| Sports | 2088 | MA | 435 | 358 | 22% |
| Scientist | 3643 | SA | 685 | 605 | 13% |
| " " | MA | 703 | 635 | 11% | |
| Military | 3046 | JU | 614 | 519 | 18% |
| " " | MA | 593 | 519 | 11% | |
| Musicians | 1248 | MA | 192 | 212 | -10% |
| Painters | 1472 | SA | 198 | 240 | -18% |
| " " | MA | 207 | 253 | -18% | |
| Writers | 1352 | MO | 288 | 224 | 29% |
| Politicians | 1002 | MO | 189 | 167 | 13% |
| " " | JU | 202 | 169 | 19% | |
| Actors | 1409 | JU | 273 | 238 | 14% |
The totals are as given on the CURA page, http://cura.free.fr/gauq/17archg.html plus various books by the Gauquelins. Textbooks by Dean et al. give the same totals per profession as here, except that the above huge scientist group is (sensibly) split into two: thus Tests of Astrology (2016, p.76) gives 1094 scientists and 2552 physicians, the same as he gave in Astrology Under Scrutiny of 2014. The data as given on the CURA site has a column that enabled the physicians and scientists to be separated.
The 'Gauquelin sectors'
The Gauquelins did all of their important work using the so-called Placidus house-divisions. This house system uses the moment when a planet rises and sets each day, and then divides its above-horizon period into six, and ditto for below the horizon. It's rather like the mediaeval hours, where there were always six hours of daytime (sun above horizon) and six of night-time (sun below horizon).
The Placidus system used the position on the ecliptic having the longitude of the planet - whereas Françoise felt that they wanted to have the rising time of the actual planet. For the Moon for example this could differ quite a bit, as it can be several degrees away from the Ecliptic.
When the Gauqelins went to California to visit Astro-Computing Services in 1980, the computer was able to brew up this new system, no longer Placidus but only resembling it, using actual i.e. astronomical rising of planets, against an ideal level horizon. That is what is nowadays called the Gauquelin sectors. They were counted in the opposite direction from the Placidus houses. Thus:
Placidus House 12 = Gauquelin sector 1
The Gauquelin totals were all re-computed by the California computer, and their significance levels were generally speaking somewhat lower. Michel published this in a 1984 article, 'Profession and Heredity Experiments, Computer re-analysis' (Correlation, Vol 4(1), pp8-24). So, what did that show? They showed that, as Michel said, his new results were somewhat lower in significance due to inadvertent bias in the hand calculations when interpolating from tables.
Thus, Michel attributed the general (slight) reduction in significance levels to errors, from him and Françoise's doing all the scoring by hand, with tables. Or, was it perhaps that the new system was not so good? Let's just say that nobody has ever demonstrated that the Gauquelin sectors worked better than did the old Placidus houses.
Check this out by uploading one of the professional groups from the CURA page, using the Jigsaw program, or the brand-new Pegasus program made by David Cochrane. Both of these offer a choice, between using the Placidus house system or Gauquelin sectors. Try it and see, does one of these score (with a planet in the Key Sectors) any better than the other?
12 or 36?
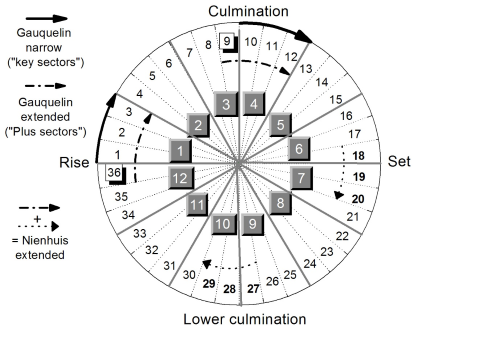
The sceptics found this adjusted house system confusing enough, especially as they were not given evidence that the new system worked any better than the old. But it got worse when in the mid-1980s Suitbert Ertel started using a 36-fold division of the daily circle, claiming that it worked better. This diagram (made by Ertel) shows how it worked. Using the twelve houses, the two Key sectors (1 and 4) were one-sixth of the total. But now, with 4 out of the 36 divisions counted as a Key Sector, the two 'plus zones' as he called them, were 2/9ths of the total.
That comes to just over 22% as the chance-expected level. You can see on the next page a graph by Ertel, where he uses that value.
 Ertel rightly observed that the two sectors here shown as 9 and 36 do tend to have a raised score: in whatever data-set the Gauquelin effect turned up, these did tend to score extra. But, for a test of significance - what everybody was concerned about - did using 8 out of 36 sectors give any better result than the old, twelvefold division?
To test for significance we use the chi-squared test (Χ2), found by calculating (Observed-Expected)2/Expected. If we take the 2088 sports champions from the above Table, Mars scored 435 times in the Key Sectors, the chance-expected value here being 358. That is a 22% excess which gives a chi-squared value of 16 - highly significant. But, using the more expanded key sectors (Ertel's 'plus zones') gives a key sector score of 553, compared to the chance-expected value of 475. That is a 16% excess, with Chi-squared of 12, a much lower significance.
One may enjoy using a 36-fold division, provided that the data-set is large enough, say over six hundred (See Section Ten for a 36-fold Venus-distribution). But for statistical testing it may be better to stick with the old, twelvefold division.