Re-evaluating the Gauquelin Data
PAGES
- Introduction
- Expected and Observed planetary frequencies in the Gauquelin professional groups
- The Ertel Enigma
- Report by the French Skeptics, 1982-96
- The Work of Arno Müller
- From the Archives
- Synastry Effects in the Gauquelin 'Heredity' Data
- Poets and the Moon
- Character traits
- Venus
- Database of Character-Traits
- Introvert-Extravert
- Physicians and Sports Champion Data
- Where's the Data?
- Was It Significant?
- A Fourfold Effect
- The Shape of the Gauquelin Professional-Data Effect
- Astro-Psychological Problems
- Françoise and Michel, a Productive Partnership
16. A Fourfold Effect
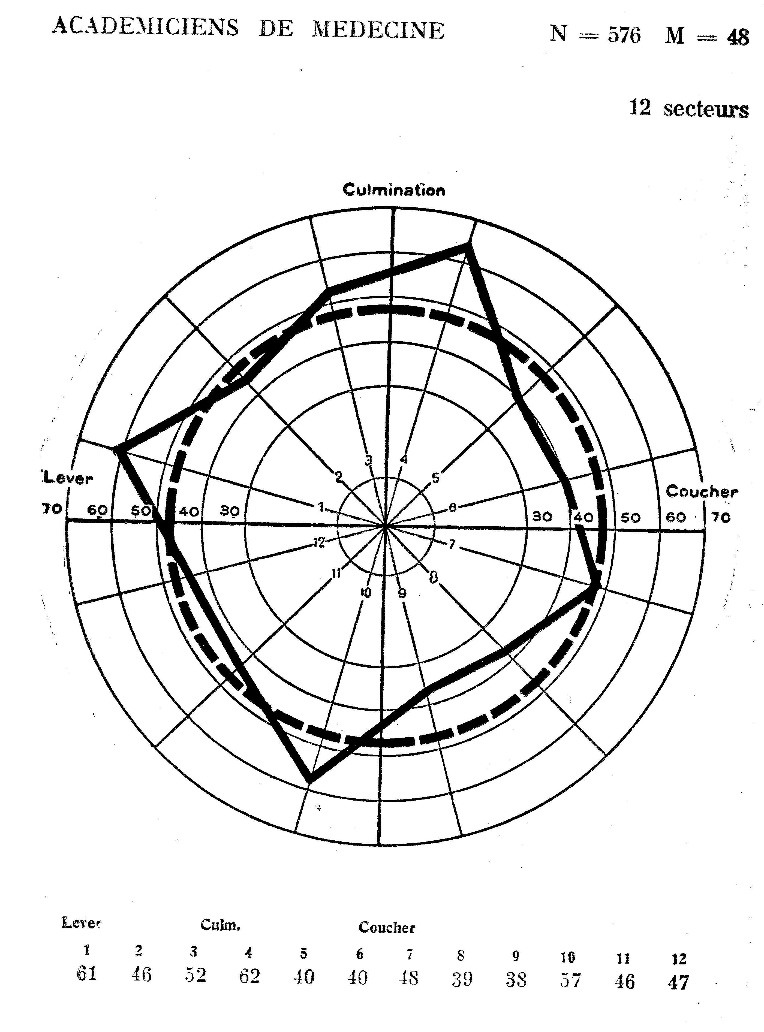 The Mars-distribution for the first Gauquelin group of physicians, drawn from the French
Académie de Médecine, (1955) is here shown (See also page 6). It has a kind of standing wave-pattern that is fourfold, a resonant pattern linked to the four 'angles' of Earth and Sky.
The Mars-distribution for the first Gauquelin group of physicians, drawn from the French
Académie de Médecine, (1955) is here shown (See also page 6). It has a kind of standing wave-pattern that is fourfold, a resonant pattern linked to the four 'angles' of Earth and Sky.
A sixteen-fold division may be the best way to examine such a 'square' pattern, because that can show four minima as well as four maxima. By breaking out of the twelvefold mould - as developed aeons ago in ancient Alexandria1 - we can better appreciate the effect. We here aim to apply a sixteen-fold structural analysis both to the professions and to the character-traits. David Cochrane has kindly added (2018) such a facility to his Pegasus program. It has the Gauquelin professional groups in its memory which is convenient.
How might one test the hypothesis, 'Saturn scores better for scientists than Jupiter, in Key sectors,' or possibly 'Saturn scores better for scientists as compared to artists'?
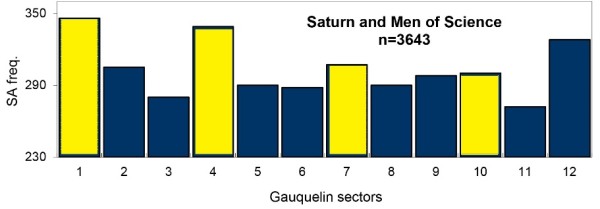
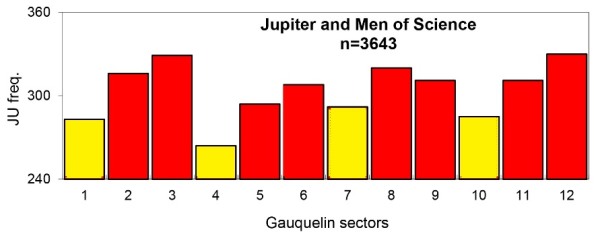
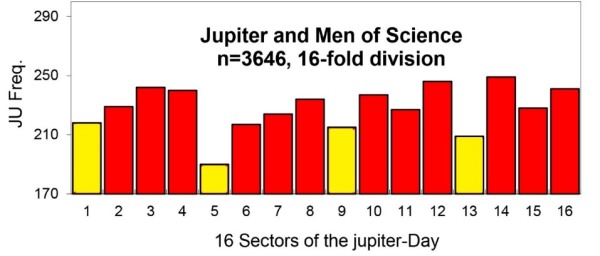
Jupiter and Saturn normally apply oppositely in the professional groups, and we found (Page 12) a corresponding polarity in their character-traits. Here are two bar-charts depicting the Gauquelin's complete 'Men of science' group. That, as we've seen, has twice as many physicians as scientists.
For the four 'cadent' houses where peaks are predicted, comparing their mean value with the others, we get:
Saturn excess: 323 ± 23 (n=4) and 293 ± 17 (n=8) => t=2.5 (not significant)
Jupiter in deficit: 281 ± 12 (n=4) and 315 ± 12 => t=4.3, a 11% difference.
Saturn here scores 7% above chance level in the four sectors. The Jupiter-deficit is more significant, because as we can see its four Key-Sector values are closer together (and so have a smaller standard deviation) than those of Saturn.
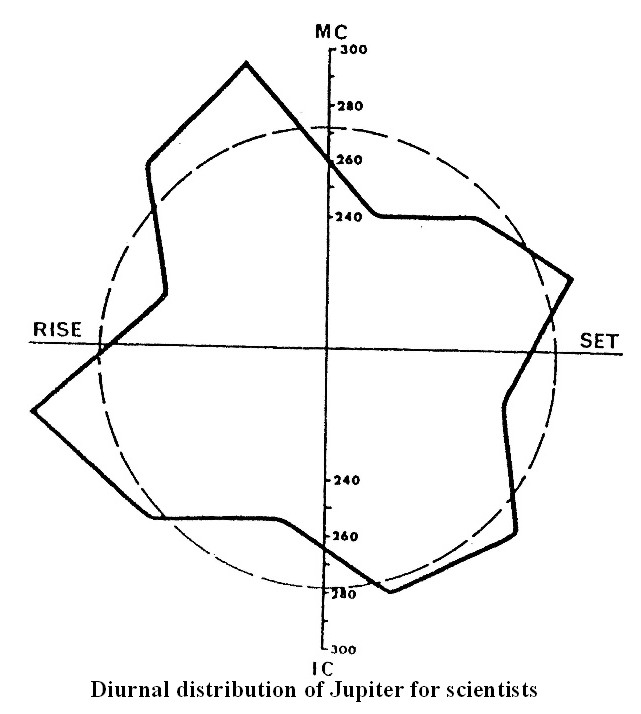 Here is John Addey's depiction of the same data - plotted for Jupiter - in circular form2. Which one do you prefer?
Looking at the bar-chart for Saturn, one can appreciate why MG preferred using just the first two Key Sectors. Taking only those first two Key Sectors, as did the Gauquelins, there is a large 23% excess of Saturn over Jupiter3.
We perform a 16-fold division on this same group, for Saturn and Jupiter. Four peaks again appear in the data for Saturn, but also midway between them we can see four minimum values. Comparing the two groups of maxima and minima:
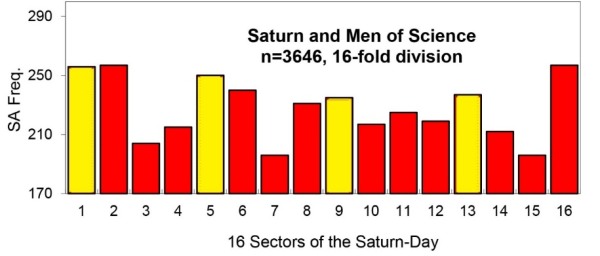
Saturn: 244 ± 9 (n = 4) and 205 ± 12 (n=4) => t = 5.3, a 17% difference
Jupiter: 208 ± 9.7 (n=4) and 230 ± 6.2 (n=4), t=3.3
Those significance tests use only half of the data. We here look at an eightfold pattern where the size of each sector is one-sixteenth of the whole. Those four sectors, just after the angles, are compared with a similar group at a one-eighth rotation. That gives a decent t-value, corresponding to a probability of one in a thousand.
Using 12 sector division as above, the four Key Sectors differed from the others by 10% of the mean; whereas using the 16-fold division, we now get a bigger maximum-minimum difference, of 17%.
The best prediction here comes from subtracting the Saturn and Jupiter scores. Then as before we get the two groups of four {SA - JU}, 36 ± 13 and -25 ± 12, and their difference is significant at t = 5.9, which is more impressive.
To summarise what we've just discovered: if an effect looks fourfold, as if it had a square structure, then a 16-fold division of the circle is probably the best way of 'seeing' it. Much of the professional data peaks mainly in just the two Key sectors, and the Gauquelins did indeed focus upon only those two. The higher significance level for a fourfold structure using the 16-fold division helps to convince us that a real phenomenon is here manifesting.
Comparison with Character-traits:
We can compare these professional-group results with the character-traits examined in Section 11. For Jupiter the top-scoring traits were Jovial, proud, authority, director energetic (n=548). In order to boost the numbers, two more traits, organizer and dynamic have been added to increase the total (but NB these don't score quite as well as the others). Dividing Jupiter's daily round into sixteen sectors gives us:
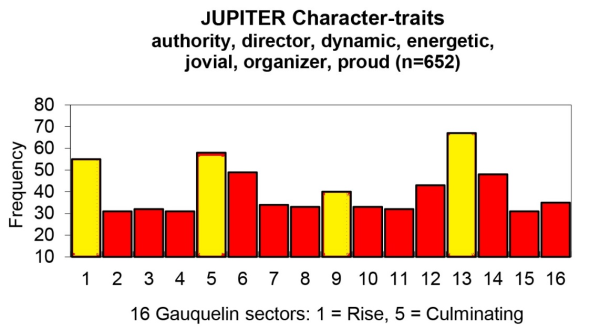
Here the four peaks in the data show a huge 72% excess on average, compared to the four in-between values (i.e., we compare sectors {1,5,9, 13} with {3,7,11,15}). That effect is four times larger than for the professional group data.
Some birthcharts occur more than once in this group, as the biography of one person can be scored with several of these Jupiter-traits. There are somewhat over four hundred natal charts in the above plot of their character-traits.
Artists: Saturn in Deficit
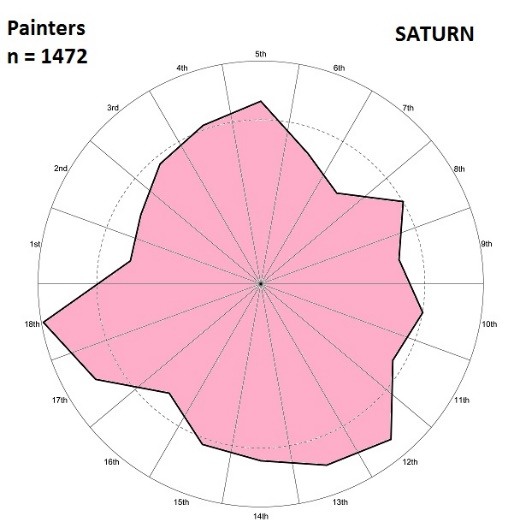 The circular graph here shows a foursquare pattern for painters, with minima in the Key Sectors. A 16-fold breakdown as before shows 'Saturn-deficit' as a 22% differential, between the 'maximum' and 'minimum' groups. The Gauquelin group 'Artists' included painters and musicians and there is here a marked difference between these two: the former has a strong negative-Saturn (see diagram) whereas for musicians there is only a negligible such effect, say -4%. Music requires a firm and in some degree traditional structure (or, it did when the data was being collected!) within which composition takes place.
- House systems were developed in ancient times when the Earth was seen as spherical and immobile and the heavens revolved around it, moving through a fixed circle in the sky made of the twelve houses. The heavenly bodies rose up in the Orient (the East) as they pass the Ascendent, climb up to the MC the Medium Coeli the 'middle of the sky' or zenith, then they descend towards the Occident, and set in the West: the Descendent. Then they go towards the Immum Coeli, the bottom of the sky, the nadir.
- Addey, New Study 1996, p.45.
- One cannot here use a t-test because it requires the standard deviation for each of the two groups, i.e. a minimum of three items per group. A t-value of 2.4 means it's significant at 1 in 20; 3.7 means 1 in 100; 5.9 means 1 in 1000.